
Visualizing HR data with Ingentis org.manager makes it easy and effective to analyze individual talents and the entire workforce, thereby allowing you to identify optimization measures to help your employees and organization leverage their full potential. The software also calculates key metrics and displays them directly within the org chart, in dashboards, or graphs. Be it headcount, gender distribution, demographic analysis, budget reconciliations, employee absences, or something completely different – Ingentis org.manager has got you covered and delivers the insights necessary to help you make informed business decisions. Check out our White Paper "HR Data visualization" in the resources tab.

With Ingentis org.manager you can analyze your organization in detail and identify areas of improvement and necessary changes. This allows you to create structures and processes that improve effectiveness and efficiency in the organization, thus making a meaningful contribution to achieving corporate objectives.

Manually creating and updating your organizational chart is a tedious task due to fluctuation and structural changes. With Ingentis org.manager you do not have to worry about outdated visualizations of your organizational structure. In addition to that, org charts created with our software solutions can be customized according to your Corporate Design guidelines. You have the control over content and design of your org chart as well as over the user interface in terms of available user tasks. No matter what form of visualization you choose, it can all be branded to meet your corporate design guidelines. Check out our product overview flyer in the resources tab.

Model potential target states of your organization based on the current situation with Ingentis org.manager. This can be done in a user-friendly manner simply via drag-and-drop. Edit existing objects, delete them, or add new ones with only a few clicks. Affected key metrics can be updated during the process while data in your SAP HCM will not be modified by changes made. Perform budgeting activities or reorganizations directly in your browser – independent from platform concerns and with no installation required. Check out our simulation flyer and our White Paper "Organizational Change" in the resources tab.
The access protection add-on allows you to restrict access to certain parts of the org chart or to specific data. For instance, you can grant managers access to an org chart with analytics while denying it for all other employees. These permissions can also be controlled by span of control, meaning that managers can be allowed to only view data for their own department.
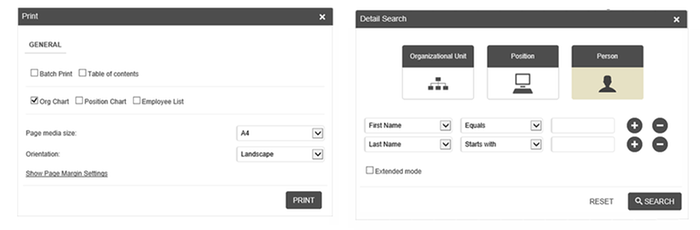
Ingentis org.manager provides extensive functionalities to satisfy printing requirements. Header and footer, size and format, and layout of the org chart can be individually defined. Flexible printing options, from printing only specific selections of the org chart to printing a full booklet of the entire organization, are included. Also, the search functionality can be configured according to your needs. Search for any information within your org chart by using either a one-step quick search or a detailed, nested search option covering multiple parameters. Moreover, you can export different perspectives as PDF or PNG file. Copy to clipboard is also available.
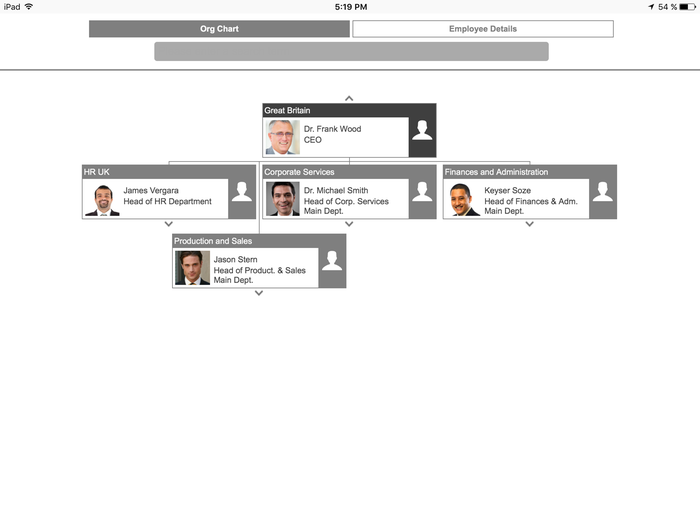
Visualize your organizational structure on any mobile device without sacrificing functionality. Your org charts will immediately transform to provide the optimal visualization on your PC, tablet or smartphone.
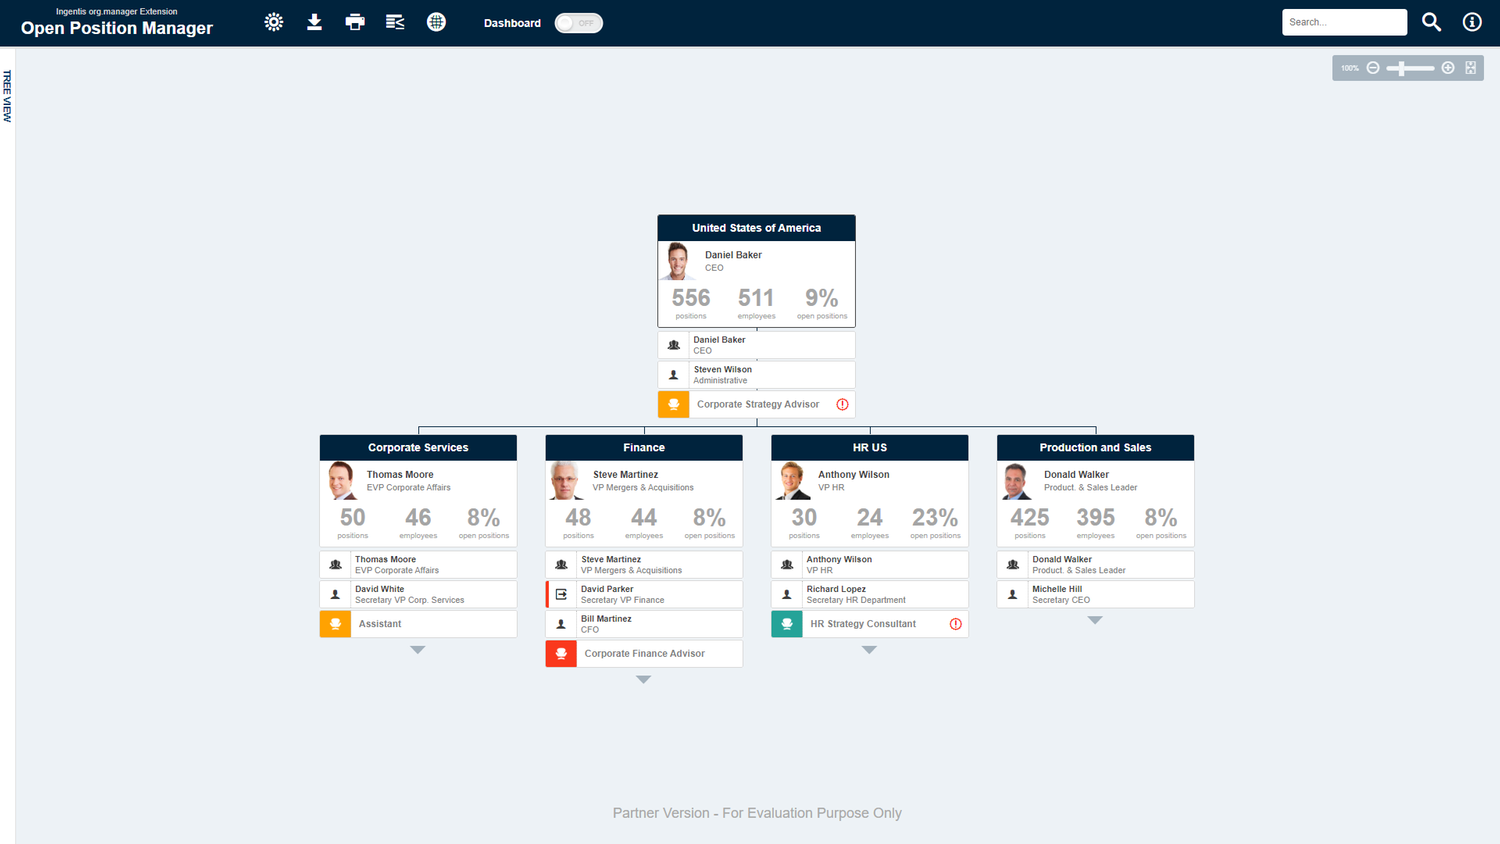
In order to help organizations more effectively manage their open positions, Ingentis has introduced a methodology based on their Ingentis org.manager solution which leverages org chart/hierarchical based reporting along with providing additional data visualization services such as a sunburst chart, a dashboard view, and data export capabilities for table based reporting. The key to these visualizations is that they provide several key metrics by both span of control and individual org units departments, cost centers, business units, etc. along with visualization rules. This allows you to gather KPIs and spotlight key information to make more informed business decisions.
Org charts are already an important tool in HR when it comes to management and workforce planning. They display complex structures and provide essential information at a glance. Why not add the visualization of KPIs and with that HR controlling to the list of workflows which org charts can facilitate? This approach is supported by the fact that most of the stored HR information is already linked to a certain object, e.g. employee, position or department, anyway. The org charting tool Ingentis org.manager uses the information you have maintained in your HR system, or additional data sources, in order to picture your organizational structure. The solution is object and relation independent and is therefore able to depict any kind of hierarchy. In addition to displaying an organization’s org chart, Ingentis org.manager can visualize further data such as key performance indicators. The created org charts and additional visualizations are customizable – no coding needed – allowing you to choose the perfect design and content for your organogram.

Ingentis org.manager helps organizations measure the diversity supported across an entire organization, including the ability to identify those departments that are top performers when it comes to diversity as well as those departments lagging behind the most in promoting an inclusive workplace. Ingentis org.manager combines the five critical diversity measures ethnicity, age, gender, persons with disability, and veteran status, and provides an overall index score for each department to see how they rate for each measure, as well as an overall combined diversity index score that combines all five measures. The key to helping organizations understand where their Diversity and Inclusion programs are effective is to provide a benchmark index score for each key metric. In the example below, you will notice an overall index score for each department that combines all five key diversity factors with any result of 100 or greater meeting or exceeding the current industry benchmark.

- Ingentis org.manager displays an org chart that measures the diversity index for ethnicity, gender, age, people with disability, and veteran status. The detail view provides a breakdown showing the employee counts and index rating for each measure based on an industry benchmark.
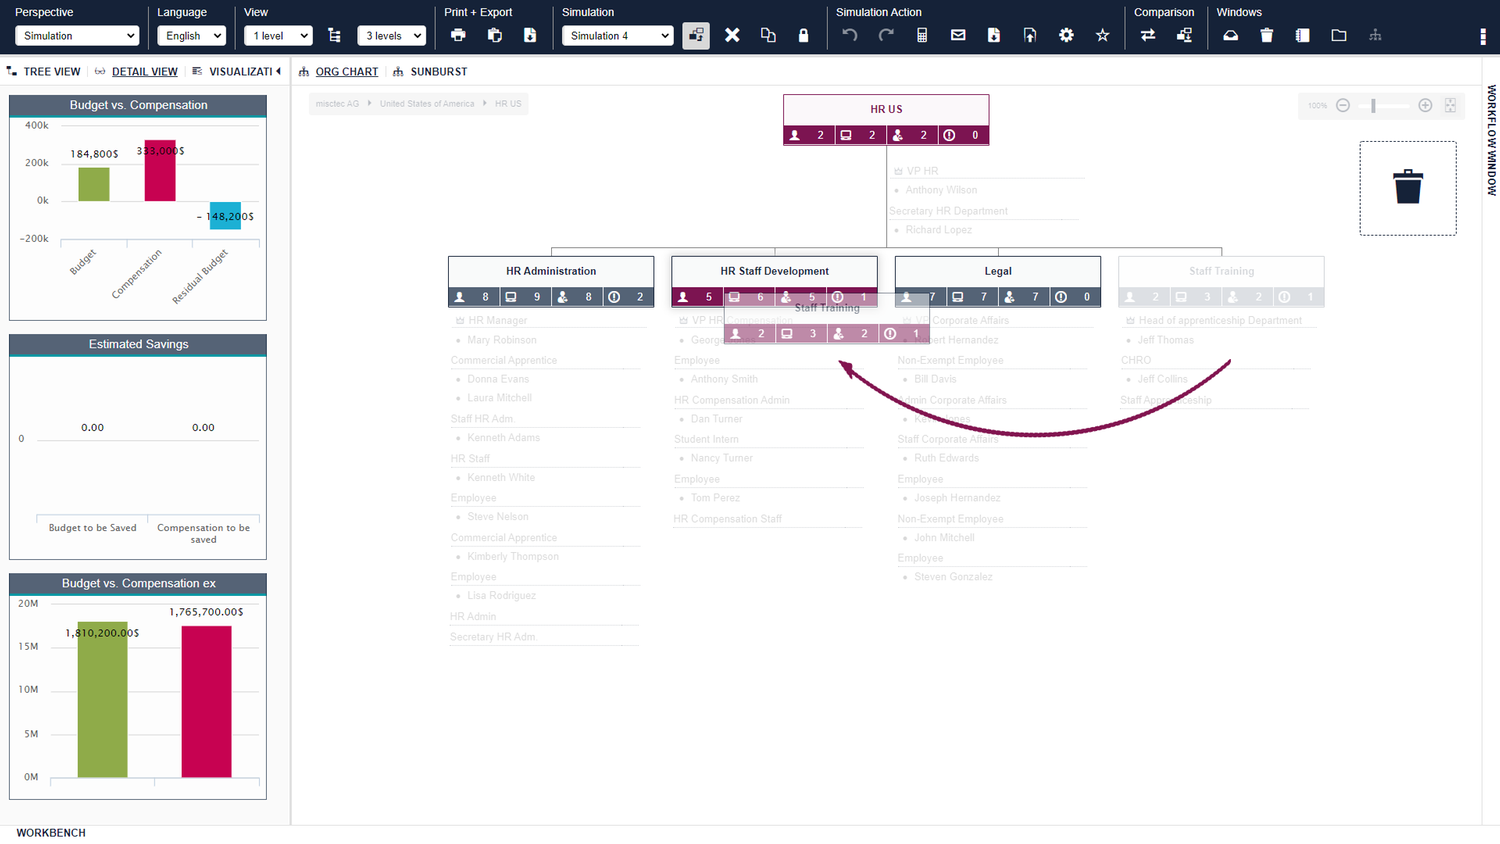
Organizational modeling is carried out in the Ingentis org.manager simulation mode by extracting and visualizing your HR and HCM data. A snapshot is taken of your data so you can visualize your current org structure while making changes in your "model" view. All without touching your HR system of record as this is entirely separate from your sandbox. Org structure modifications are easily accomplished by simple drag-and-drop when moving persons or positions to change the reporting relationship. You can also create new positions or departments in one step. As changes occur, you get immediate feedback for the measurable results such as headcount and budget. While working on multiple what-if scenarios, you can quickly view and export all new additions, changes, and deletions made in your model based on positions, persons, departments, and business units. Summary roll-up of key metrics like headcount and salary help you manage quantitative goals for the transformation to be conducted. Modeling is also a collaborative exercise and you can fully control who has read and write access to your models, along with log analysis to view each change made. Modeling can be performed in a centralized or distributed manner, reflective of your current organizational structure.

- The modeling exercise begins by displaying the current organizational structure (“the now”) along with calculating the key metrics such as headcounts, budget and expenses that will update as modifications are made.